Personal Projects

Table of Contents

1. Dataset Generator: Dot or No-Dot
1.1 Description
1.2 Code
1.3 Images
2. Dataset Generator: Tetris Classifier
2.1 Description
2.2 Code
2.3 Images
3. Model 1: Combining Graph Theory and KNN Regression
3.1 Description
3.2 Code
3.3 Results

1. Dataset Generator: Dot or No-Dot

1.1 Description

One of the great problems in the realm of Domain Generalization is generalizing the idea of numbers such that I could train a machine learning model on a data set like MNIST then use that model to accurately classify another number dataset like USPS or SHVN. Current models struggle to generalize since they are unable to capture the abstract idea of number. When a model is trained on a number set, its description of a number is rooted in size, color, shape, and location. So when the model is tested on another dataset where the representation of a number may vary in the aforementioned qualities, the model fails. So the question is, can we develop a model to generalize.

I realized early on that to find such a model it is first worth simplifying the data set so that the object being abstracted is simple. So I came up with the idea of the Dot or No-Dot data set. The code I have above generates images of specified dimension and quantity, half of which have a dot and the other half does not. The images that have no dot are a randomly selected gradient. In images with a dot, I randomly vary the background color, the background gradient, the dot color, the dot location, and the dot size. As a result, in each image the idea of a dot or no dot is represented differently, hence a model that is able to classify the images correctly has abstracted the idea of dot invariant of color, size and location. The motivation is that such a model may also be able to abstract the idea of a number.

1.2 Code


        import numpy as np
        import matplotlib.pyplot as plt
        from random import randint, choice
                
        def generate_mixed_dataset(num_images):
            images = []  # Store generated images
            labels = []  # Store labels for the images
                
            for _ in range(num_images // 2):
                # Create a homogeneous background image
                base_color = np.random.randint(0, 256, 3)  # Pick a random color
                homogeneous_image = np.zeros((32, 32, 3), dtype=np.uint8)
                for x in range(32):
                    for y in range(32):
                        # Add some random variation to the color
                        variation = np.random.randint(-10, 11, 3)
                        pixel_color = np.clip(base_color + variation, 0, 255)
                        homogeneous_image[x, y] = pixel_color
                images.append(homogeneous_image)
                labels.append(0)  # 0 for no dot
                
                # Create an image with a dot on a gradient background
                base_color = np.random.randint(0, 256, 3)  # Again, pick a random color
                gradient_image = np.zeros((32, 32, 3), dtype=np.uint8)
                for x in range(32):
                    for y in range(32):
                        # Make a gradient variation
                        variation = np.random.randint(-10, 11, 3)
                        pixel_color = np.clip(base_color + variation, 0, 255)
                        gradient_image[x, y] = pixel_color
                dot_size = randint(1, 4)  # Choose a random size for the dot
                x = randint(0, 32 - dot_size)  # Random position for the dot
                y = randint(0, 32 - dot_size)
                dot_color = np.random.randint(0, 256, 3)  # Random color for the dot
                # Make sure the dot color stands out
                while np.any(np.abs(dot_color - gradient_image[x, y]) < 20):
                    dot_color = np.random.randint(0, 256, 3)
                for i in range(dot_size):
                    for j in range(dot_size):
                        gradient_image[x + i, y + j] = dot_color  # Place the dot
                images.append(gradient_image)
                labels.append(1)  # 1 for dot present
                
            return images, labels
            

Brief overview of the coding aspects of the project or links to code repositories...

1.3 Images

2. Dataset Generator: Tetris Classifier

2.1 Description

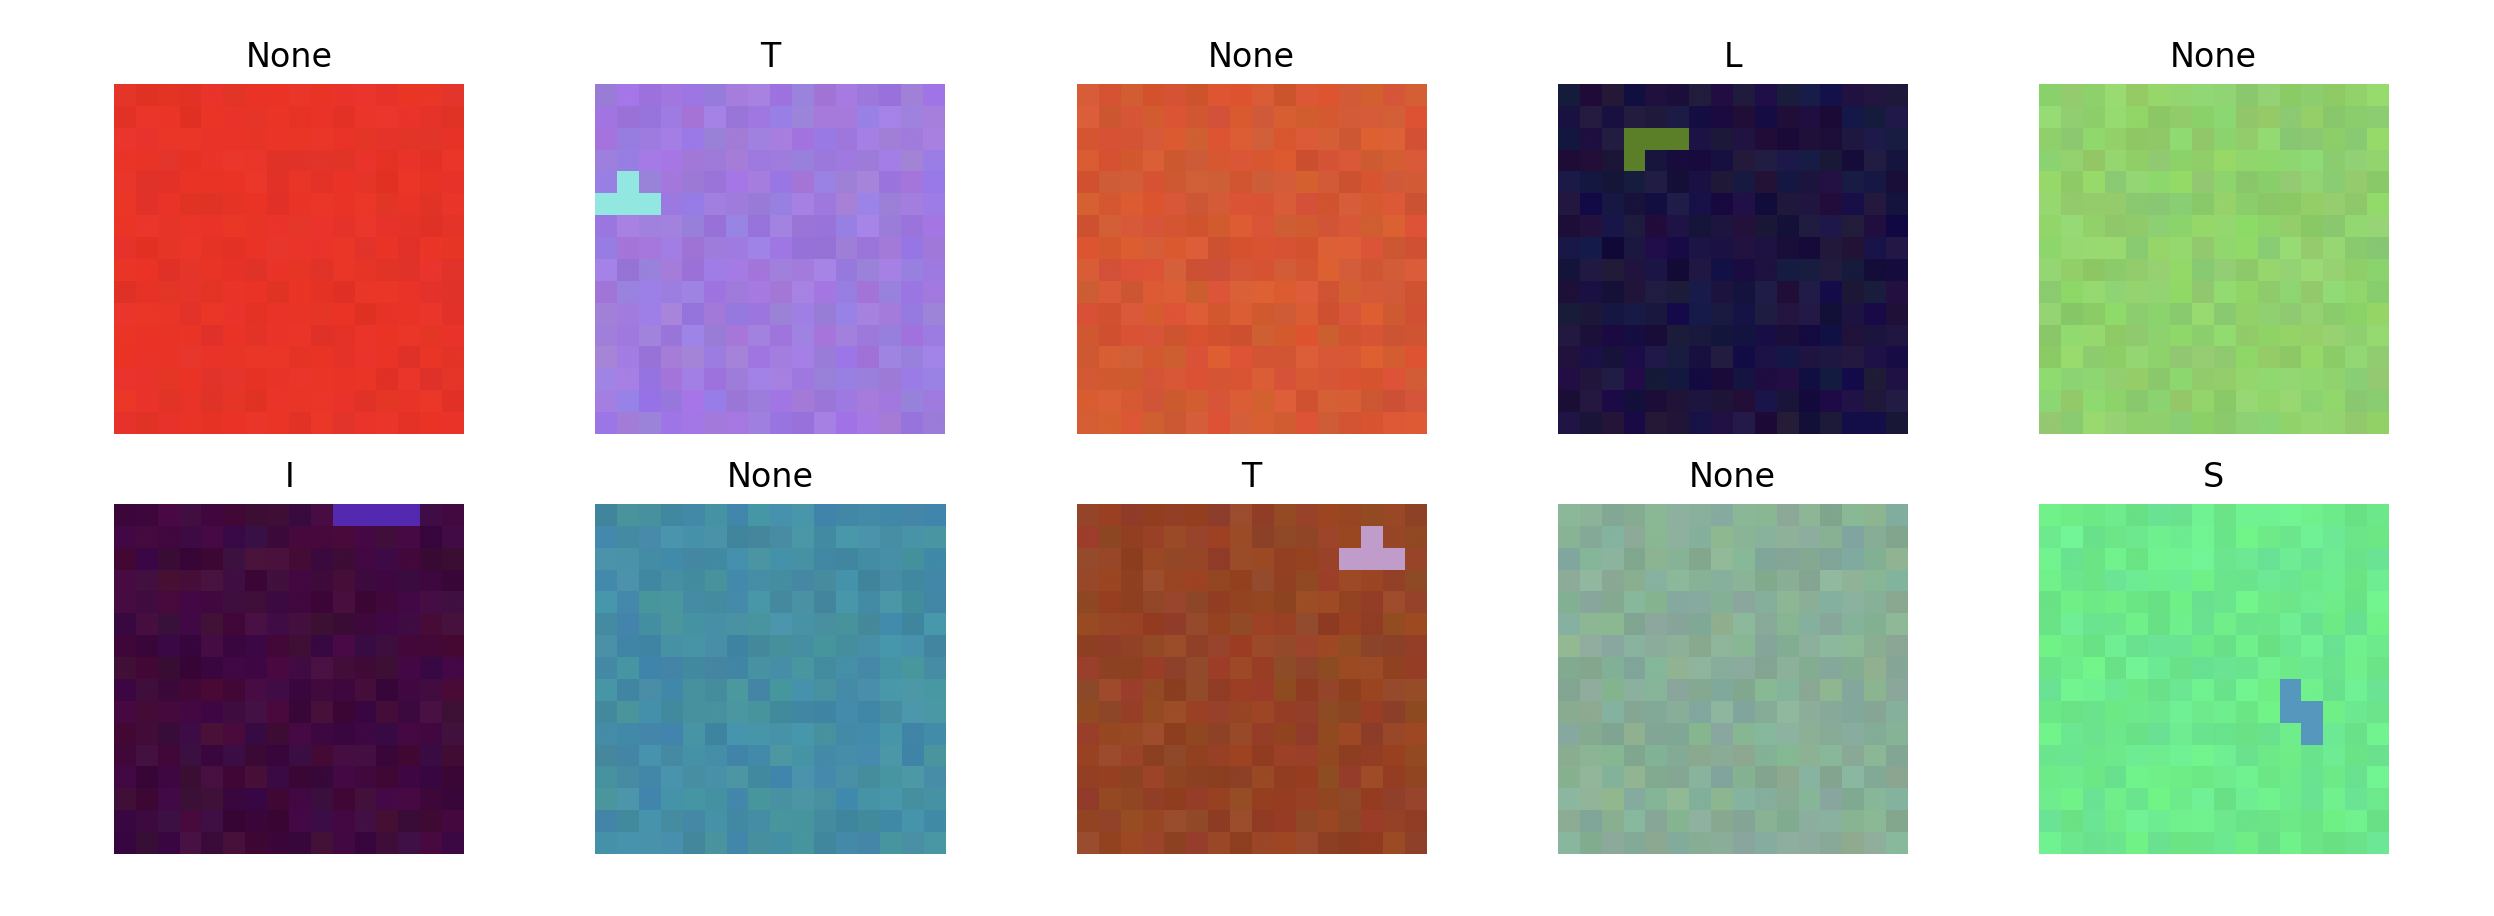
The following code is the code I used to generate randomly, color, located, oriented tetris shapes. The following dataset represents the next step for a model built to abstract structures. Unlike the dot example, the following dataset requires that model to understand also the structure of the object, invariant to the structure's orientation. Additionally, the task also increases in difficulty now that the classifier must be non-binary. A model that is able to classify the following dataset appropriately may be robust enough for other complex structures like shapes,or maybe even numbers.

2.2 Code


        import numpy as np
        import matplotlib.pyplot as plt
        from random import randint, choice
                
        def generate_tetris_shape(shape_type):
            shapes = {
                "I": np.array([[1, 1, 1, 1]]),
                "O": np.array([[1, 1], [1, 1]]),
                "T": np.array([[1, 1, 1], [0, 1, 0]]),
                "S": np.array([[0, 1, 1], [1, 1, 0]]),
                "L": np.array([[0, 0, 1], [1, 1, 1]])
                    }
            return shapes[shape_type]
                
        def rotate_shape(shape):
            return np.rot90(shape, k=randint(0, 3))
                
        def generate_mixed_dataset(num_images, image_dim):
            images = []
            labels = []
                
            for _ in range(num_images // 2):
                # Homogeneous background image
                base_color = np.random.randint(0, 256, 3)
                homogeneous_image = np.zeros((image_dim, image_dim, 3), dtype=np.uint8)
                for x in range(image_dim):
                    for y in range(image_dim):
                        variation = np.random.randint(-10, 11, 3)
                        pixel_color = np.clip(base_color + variation, 0, 255)
                        homogeneous_image[x, y] = pixel_color
                images.append(homogeneous_image)
                labels.append("None")
                
                # Image with a Tetris shape
                base_color = np.random.randint(0, 256, 3)
                gradient_image = np.zeros((image_dim, image_dim, 3), dtype=np.uint8)
                for x in range(image_dim):
                    for y in range(image_dim):
                        variation = np.random.randint(-10, 11, 3)
                        pixel_color = np.clip(base_color + variation, 0, 255)
                        gradient_image[x, y] = pixel_color
                
                shape_type = choice(["I", "O", "T", "S", "L"])
                shape = generate_tetris_shape(shape_type)
                shape = rotate_shape(shape)
                
                x = randint(0, image_dim - shape.shape[0])
                y = randint(0, image_dim - shape.shape[1])
                shape_color = np.random.randint(0, 256, 3)
                for i in range(shape.shape[0]):
                    for j in range(shape.shape[1]):
                        if shape[i, j] == 1:
                            gradient_image[x + i, y + j] = shape_color
                
                images.append(gradient_image)
                labels.append(shape_type)
                
            return images, labels


Brief overview of the coding aspects of the project or links to code repositories...

2.3 Images

3. Model 1: Combining Graph Theory and KNN Regression

3.1 Description

The challenge of accurately classifying images of dots and Tetris shapes primarily revolves around how these images are represented, rather than the intricacies of the classification model itself. The objective is to develop an image representation that is invariant to specific factors such as the location, size, and color of the shapes. To achieve this, we adopt an innovative approach by using a weighted complete graph to describe each image. In this graph, each pixel is a node, and the edges between these nodes are weighted based on the similarity between two pixels, determined by their color difference and spatial distance. This methodology is particularly effective in identifying dots, as they tend to form nodes that are distant from other nodes in the graph.

The process begins with the image_to_graph function, which iterates through every pixel in the image. For each pixel, a vector is created, with each entry representing the weight of the pixel's edge to other pixels. The weight is set to zero if the pixels differ in color, and if they are the same color, it is inversely proportional to their distance. The vectors are then sorted in decreasing order based on these weights, keeping only the top K weights for each pixel, thereby focusing on each pixel's K closest neighbors.

Following this, the create_graph_from_image function takes over. It organizes the vectors of nodes based on their magnitude in increasing order, highlighting the node that is least related to any others. The matrix of vectors is then flattened into a single large vector, corresponding to each image. This large vector encapsulates the relational dynamics of the nodes that stand out in the graph.

Finally, this graph-based representation of images is utilized to train a K-Nearest Neighbors (KNN) regression model. The model predicts whether an image contains a dot or a Tetris shape by analyzing the isolation of certain nodes (pixels) from others within the graph. This approach shifts the focus from the absolute characteristics of pixels to their relational structure within the image, enabling an effective classification of dots and Tetris shapes.

3.2 Code


                import numpy as np
                from sklearn.model_selection import train_test_split
                from sklearn.neighbors import KNeighborsClassifier
                from sklearn.metrics import accuracy_score

                def calculate_edge_weight(pixel1, pixel2, coord1, coord2, color_similarity_threshold=15):
                    # Calculate spatial distance and normalize it
                
                    spatial_dist = np.linalg.norm(np.array(coord1) - np.array(coord2))
                
                    # Calculate color distance
                    color_dist = np.linalg.norm(np.array(pixel1) - np.array(pixel2))
                
                    # Check if the color distance is within the similarity threshold
                    if color_dist < color_similarity_threshold:
                        # If colors are similar, return the normalized spatial distance
                        return 1/spatial_dist
                    else:
                        # If colors are not similar, return 0
                        return 0.0
                
                
                def image_to_graph(image):
                    num_pixels = image.shape[0] * image.shape[1]
                    node_vectors = np.zeros((num_pixels, num_pixels))
                
                    for x1 in range(image.shape[0]):
                        for y1 in range(image.shape[1]):
                            idx1 = x1 * image.shape[1] + y1
                            for x2 in range(image.shape[0]):
                                for y2 in range(image.shape[1]):
                                    idx2 = x2 * image.shape[1] + y2
                                    if idx1 != idx2:  # Avoid self-edges
                                        weight = calculate_edge_weight(image[x1, y1], image[x2, y2], (x1, y1), (x2, y2))
                                        node_vectors[idx1, idx2] = weight


                    sorted_node_vectors = np.sort(node_vectors, axis=1)[:, ::-1][:, :25]  # Tune the 25, it represents K, or the amount of entries of each vector we want to keep
                    return sorted_node_vectors
            
                def create_graphs_from_images(images, labels):
                    graph_vectors = []
                    for i, image in enumerate(images):
                        sorted_vectors = image_to_graph(image)
                        # Sort nodes by the magnitude of their vectors in increasing order
                        magnitudes = np.linalg.norm(sorted_vectors, axis=1)
                        sorted_indices = np.argsort(magnitudes)  # Sort in ascending order
                        sorted_vectors = sorted_vectors[sorted_indices]
                        # Flatten to a single vector and append the label
                        flattened_vector = sorted_vectors.flatten()
                        labeled_vector = np.append(flattened_vector, labels[i])
                        # Get the first entries of the vector
                        first_entries = labeled_vector[:1000] #1000 represents how many entries of the large vector we want to have
                        graph_vectors.append(first_entries)
                    return graph_vectors
                
                # Use the generated dataset
                labeled_graphs = create_graphs_from_images(dataset_images, dataset_labels)
        
                
                # 'labeled_graphs' contains the flattened, sorted, labeled graph representation of each image
                
                
                # Separate the features and labels
                features = np.array([graph[:-1] for graph in labeled_graphs])
                print(features)
                labels = np.array([graph[-1] for graph in labeled_graphs])
                
                # Splitting the dataset into training and testing sets
                X_train, X_test, y_train, y_test = train_test_split(features, labels, test_size=0.2, random_state=42)
                
                # Create a KNN classifier instance
                # 'n_neighbors' is the K value. You might need to experiment with this number to find the optimal value.
                knn = KNeighborsClassifier(n_neighbors=3)
                
                # Train the classifier
                knn.fit(X_train, y_train)
                
                # Make predictions
                y_pred = knn.predict(X_test)
                
                # Calculate accuracy
                accuracy = accuracy_score(y_test, y_pred)
                print(f"Test Accuracy: {accuracy * 100}%")


3.3 Results

How does the model perform? Well it actually performs exceptionally, classifying both the dot dataset and the tetris shape dataset with 100% accuracy. Interesting enough, the model only needs to be trained with about 100 cases to achieve this accuracy. Surprisingly, when I used the model to classify 0, 1 ,2 and 3 in the MNIST dataset, it did so with 86% accuracy with only 300 training cases. This all points to the concept being viable, yet it still requires tuning.

Most of the model/method is built using my intuition, so it's yet to be optimized. I have already thought of several ways of improving it, such as using a different ML model instead of KNN, as well as refining the graph vectorization process such that more information about the image’s structures are retained. Regardless, there is still untapped potential yet to be explored.